Evogia’s Role‑Based Solutions
Whether you fight shrink, run daily ops, or shape shopper journeys, Evogia delivers real‑time data and action playbooks tuned to your responsibilities.
Marketing & Customer Insights
Correlate campaigns to footfall and sales in real time. Segment personas, measure uplift, and ask plain‑language questions for instant answers.
Merchandising & Visual Teams
Know which displays convert browsers to buyers. Heat‑maps, dwell metrics, and A/B reports help iterate fixtures and planograms with confidence.
Store Operations Managers
Mission‑control view of live occupancy, service‑level breaches, and staffing gaps. Nightly playbooks suggest precise roster tweaks and layout fixes.
Loss‑Prevention Teams
Replace endless rewinds with AI‑ranked incident queues. Evogia surfaces high‑risk clips, bundles evidence, and slashes investigation time.
Marketing & Insights – Campaign ROI in Real Time
Segment personas, measure uplift, and ask RAG questions like ‘Did Gen‑Z males buy more after the sneaker drop?’ — get charts instantly, no SQL.

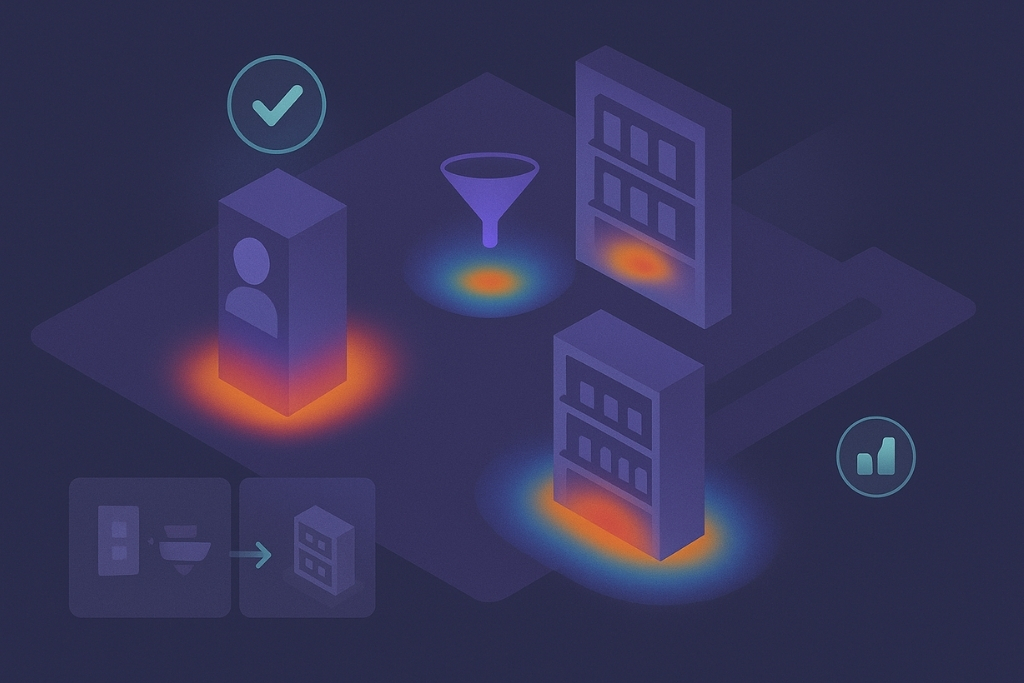
Merchandising & VM – Iterate Displays with Data
Heat‑maps and dwell funnels reveal which fixtures drive revenue. A/B templates make planogram experiments measurable in days, not months.
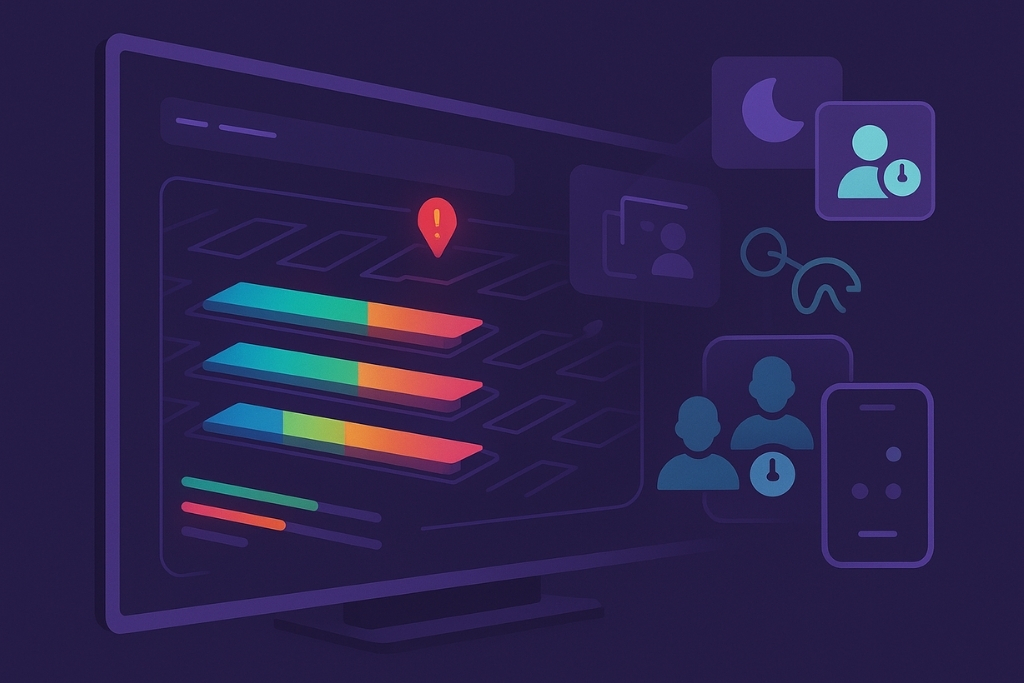
Store Operations – Mission Control for Every Aisle
See live occupancy, queue times, and service‑level breaches in one dashboard. Nightly playbooks recommend roster tweaks and quick layout fixes.
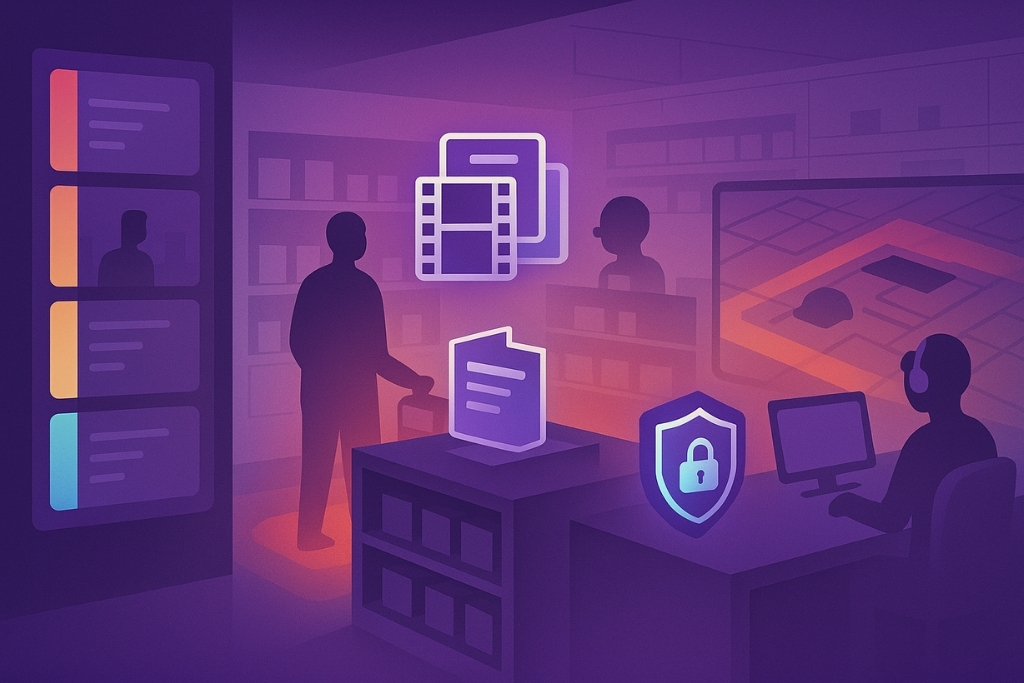
Loss‑Prevention – AI Evidence, Zero Guesswork
Survey less, act more. Evogia ranks stores, aisles, and SKUs by shrink risk, then packages evidence clips for rapid case closure and staff training.

Contact Us
Reach out to us for a demo or any specific customization required to streamline your workflow & customer data analysis on your video footage in your preferred way.
© 2022 WorkRyt Technologies Private Limited