Blind Spots in Display Performance
POS shows what sold, not which fixture drove the sale. You’re guessing which layouts resonate with shoppers.

Know exactly which displays convert browsers into buyers. Evogia turns camera data into fixture-level heat-maps, A/B reports, and nightly playbooks so you iterate layouts with confidence.
POS shows what sold, not which fixture drove the sale. You’re guessing which layouts resonate with shoppers.
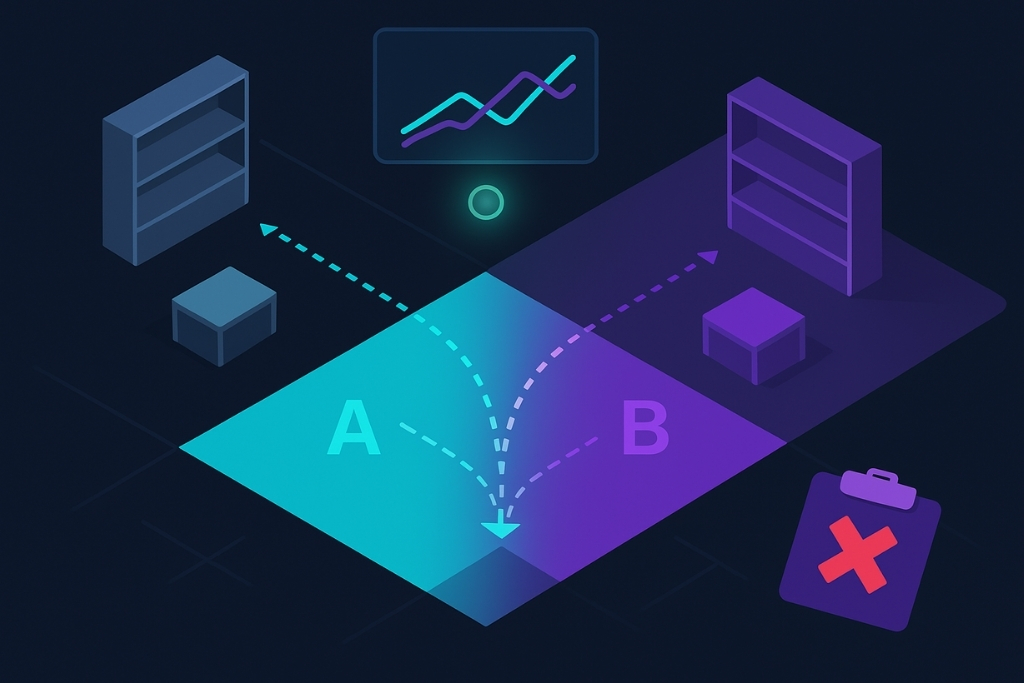
Traditional A/B testing takes weeks and manual audits. By the time results arrive, seasons change and displays move on.
Corporate VM rules ignore local shopper behavior. Store teams need data-backed tweaks, not generic directives.
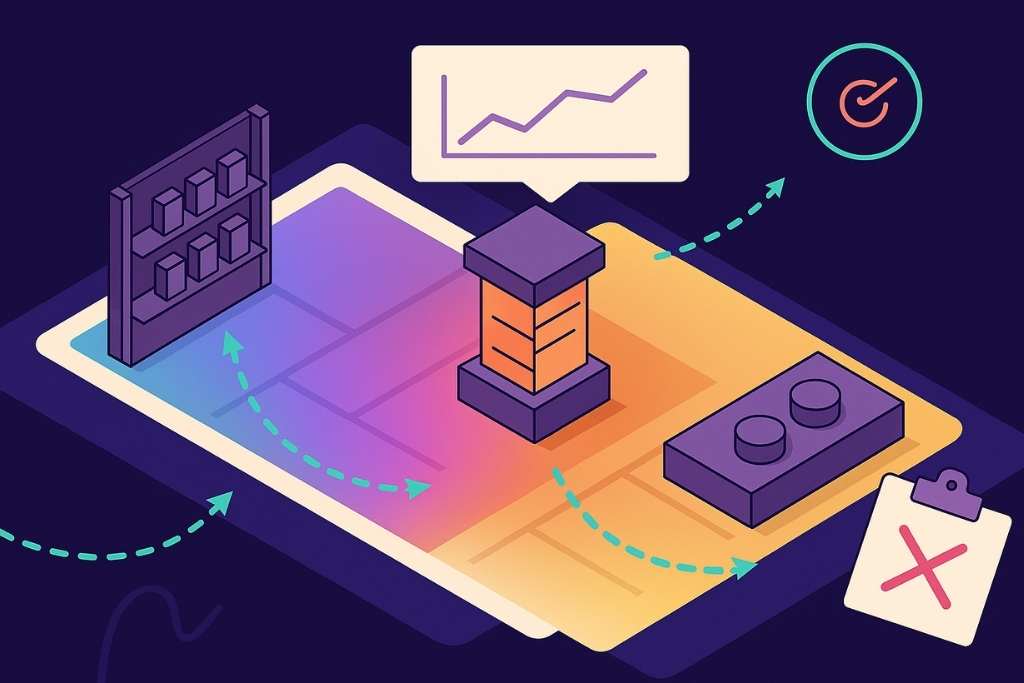
Colour-coded dwell maps show which shelves, end-caps, and promo tables pull shoppers in—and which get ignored.
Run layout experiments without manual audits. Evogia auto-splits traffic and reports uplift in days, not weeks.
Track the full path: dwell → pick-up → basket add → purchase. Spot which displays attract attention but fail to convert.

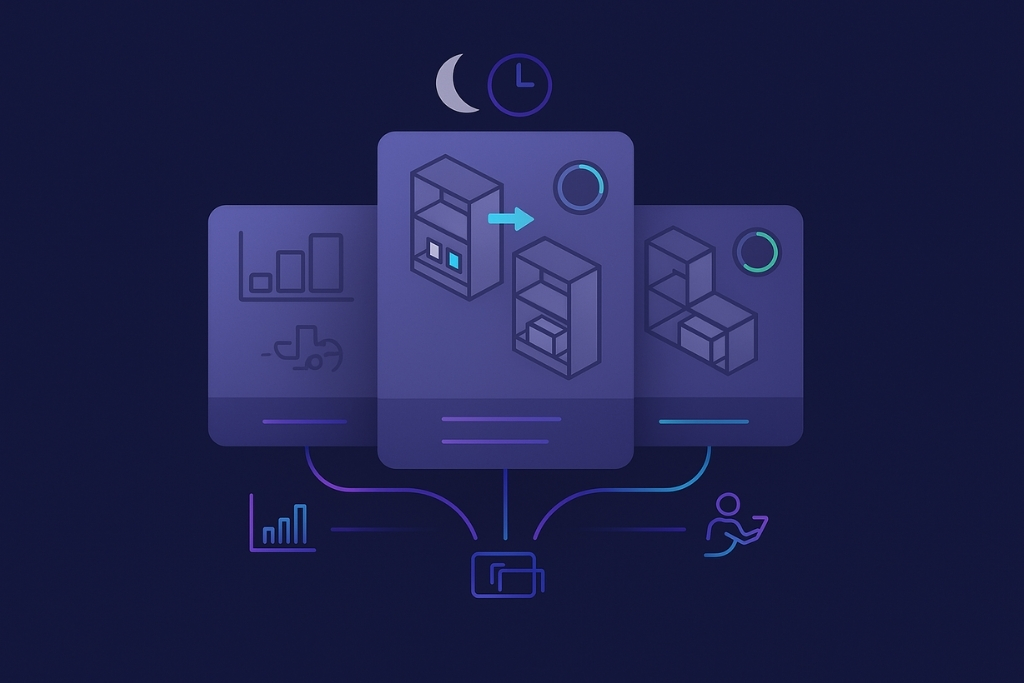
Every night, Evogia recommends precise moves—shift an end-cap 1 m, swap colourways, or restock a hot SKU—each with projected ROI.
22%
Display-Driven Sales Uplift
4×
Faster Planogram Iteration
19%
Shrink Reduction in Hot Zones
Book a live demo or chat with our team on WhatsApp to see how Evogia supercharges merchandising decisions.