Inconsistent Store Performance
Footfall, conversion, and shrink vary wildly across locations, but HQ can’t spot the outliers fast enough to intervene.

Compare, benchmark, and optimise every store from a single command centre. Evogia shows HQ where to focus, what to copy-paste, and how to raise the floor for the whole fleet.
Footfall, conversion, and shrink vary wildly across locations, but HQ can’t spot the outliers fast enough to intervene.
Mystery shopping and regional inspections are slow, expensive, and miss day-to-day fluctuations that erode margin.
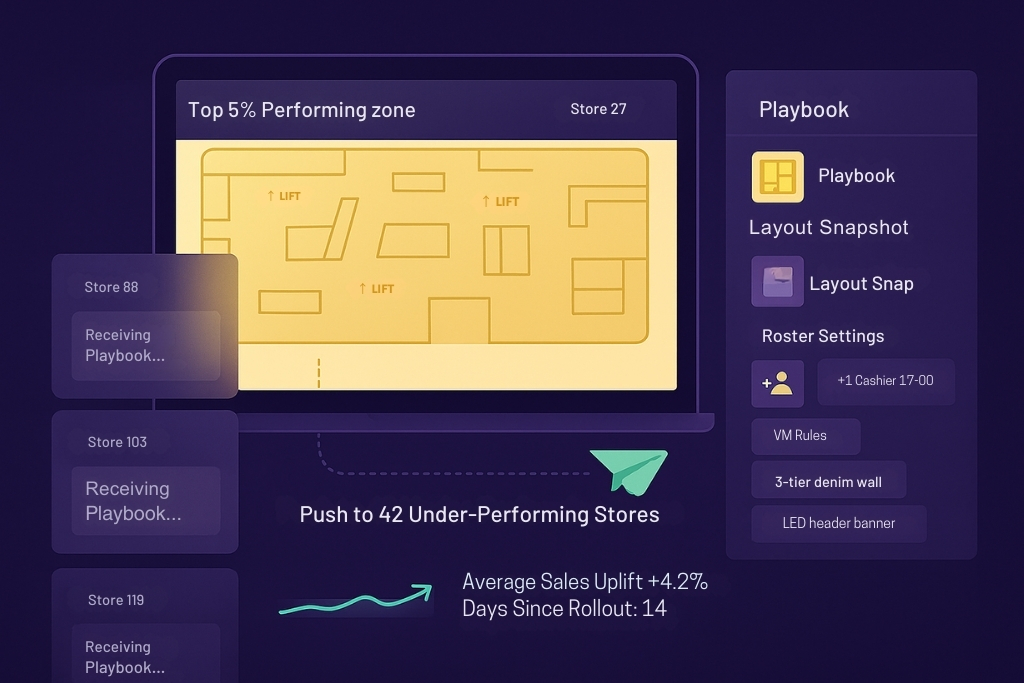
Once a winning layout or staffing model is found, rolling it chain-wide takes months because evidence is siloed and change-management is guesswork.
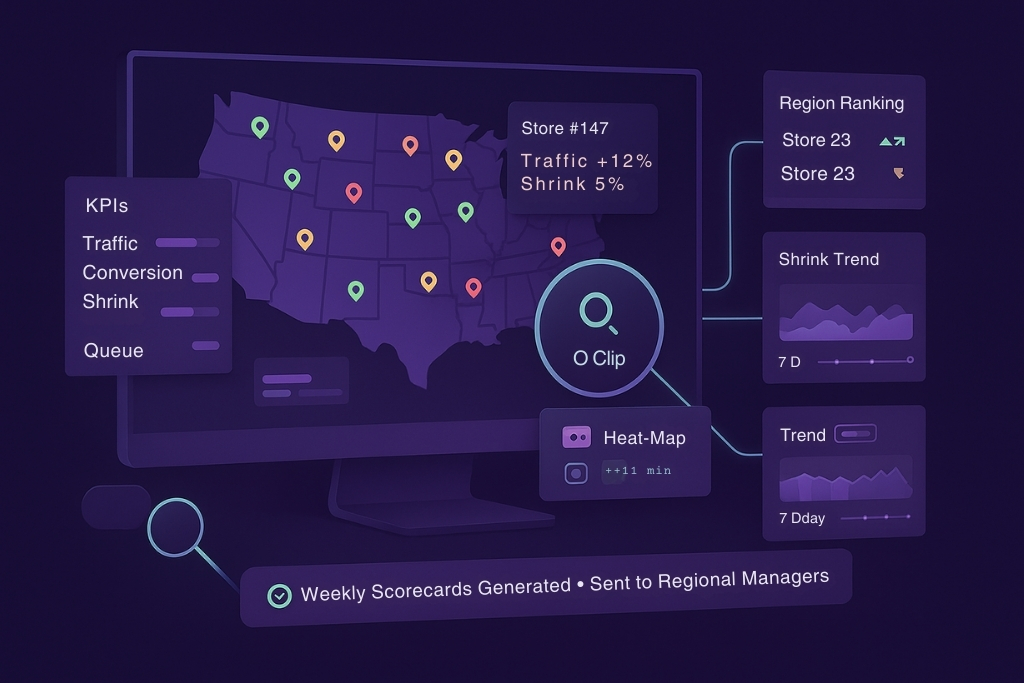
One live map ranks every store on traffic, conversion, shrink, and queue KPIs so HQ can zoom into problems before they snowball.
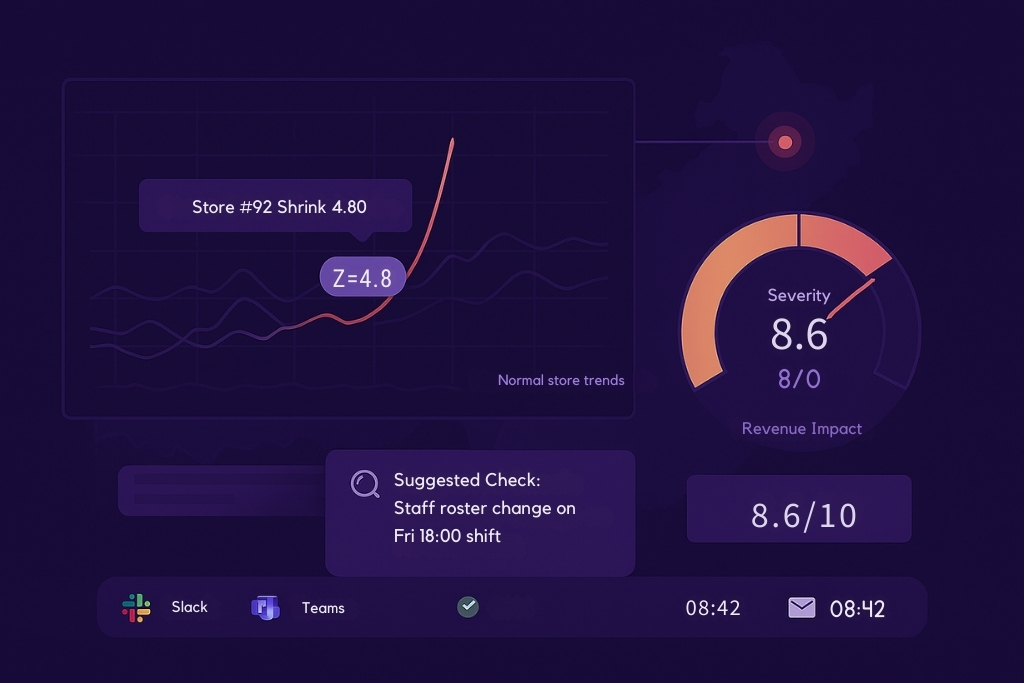
AI flags stores that suddenly spike in shrink or dip in sales uplift, triggering alerts and suggested root-cause checks.
Evogia learns from top-performing branches and auto-generates roll-out templates—layout snapshots, roster settings, and VM rules.
Stream anonymised video metrics, POS joins, and shrink stats straight into corporate data lakes, dashboards, or AI COEs.

2.4×
Faster Best-Store Benchmarking
27%
Shrink Reduction Chain-Wide
14 Days
Median Payback Period
Book a demo or ping us on WhatsApp to see how Evogia turns dozens—or thousands—of stores into one data-driven machine.